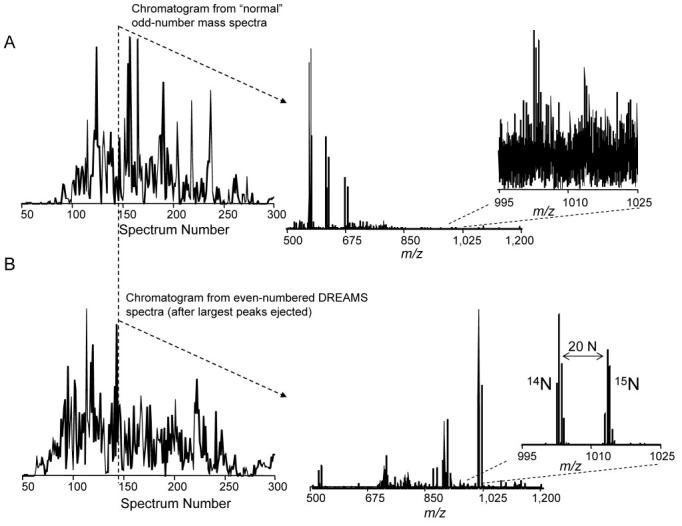
Figure 20.

Total ion chromatograms (TIC) for capillary LC-FTICR-MS analyses, along with typical mass spectra acquired (A) during the “normal” spectrum acquisition process and (B) the alternating DREAMS spectrum acquisition process for the analysis of peptides from a mixture of natural isotopic abundance and 15N-labeled mouse B16 cells. (A, left) TIC reconstructed from the normal FTICR mass spectra. (B, left) corresponding TIC obtained using DREAMS for which species having relative abundances >10% were ejected before ion accumulation. The mass spectra (A&B, center) show the effective ejection of the major species in the top spectrum from the one shown on the bottom. The detail (A&B, right) shows that a large gain in sensitivity and S/N is obtained for measurement of a specific peptide pair providing improved qualitative and quantitative results from the overall analysis. Reprinted by permission of Elsevier from Paša-Tolić, et al., 2002. Copyright 2002, by the American Society for Mass Spectrometry.
