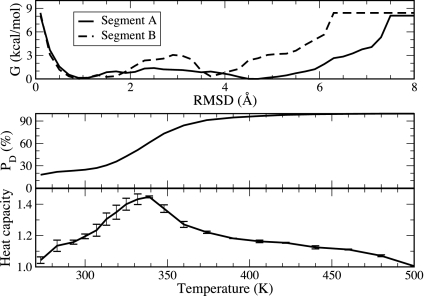
Fig. 4.
Thermodynamic properties obtained from REMD simulations. (Top) Free-energy profiles of HP35 from REMD at 300 K based on Cα-rmsd of the two segments A and B. (Middle) Population of the denatured state as a function of temperature. (Bottom) Heat capacity as a function of temperature. The first 50 ns of the simulation trajectories were excluded from the analysis. The error bars of the heat capacity were obtained by dividing the trajectories into two blocks (50–125 ns and 125–200 ns).

