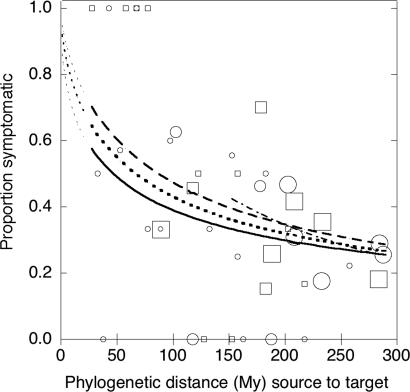
Fig. 1.
Proportion of target plant species that developed disease symptoms after inoculation with fungal pathogens from source plant species. Logistic regressions were performed on results of individual pathogen–host combinations, but data were grouped into 5-My source-target phylogenetic distance classes for illustration. Circles (Forest study) and squares (Nursery study) indicate the proportion of inoculations within a 5-My class that produced disease symptoms. Lines indicate the predicted proportion symptomatic based on logistic regression for the Forest study (solid line), the Nursery study (dashed line), or all data combined (dotted line). Fine dotted lines show extrapolation of predictions to shorter phylogenetic distances than represented by experimental data. Size of symbol indicates the number of inoculation pairs included in the distance class (grouped as <10, 10–30, or >30 inoculations). Logistic regressions were performed on raw (not binned) data. The logistic fit still shows slope when pairs of <135 My are excluded (dash–dot line). The logistic regression formulas are: forest: logit(S) = 2.2327 − 1.3428 × (log10(distance + 1)), χ2 = 6.96, P = 0.0084, n = 578; Nursery: logit(S) = 3.4096 − 1.7562 × (log10(distance + 1)), χ2 = 7.66, P = 0.0056, n = 384; Combined: logit(S) = 2.9113 − 1.5944 × (log10(distance + 1)), χ2 = 16.71, P = 0.0001, n = 962; and combined, >135 My: logit(S) = 5.93699 − 2.85376 × log10(distance + 1); χ2 = 8.09, P = 0.004, n = 821; where Prob(symptomatic) = exp(logit(S))/[1 + exp(logit(S)].

