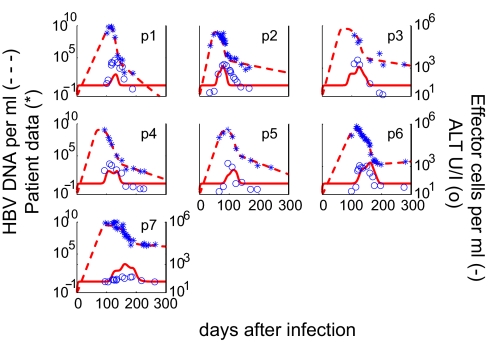
Fig. 1.
Results of fitting the model to each patient's HBV DNA data and the relationship between effector cells and serum ALT during the acute phase of the infection. The best fit of the model (dashed lines) to HBV DNA patient data (∗) is indicated. The measured serum ALT (○), which was not used in data fitting, compares well with the predicted dynamics of the HBV-specific effector cell response (solid lines).

