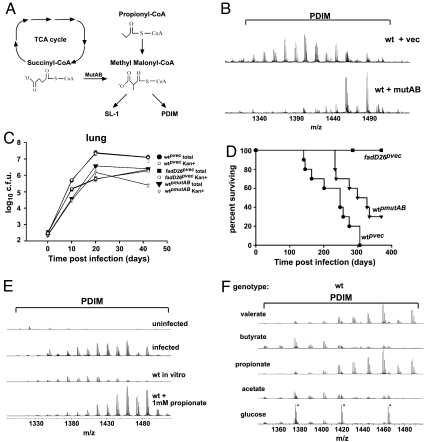
Fig. 4.
Regulation of PDIM and SL-1 synthesis during infection. (A) Pathway depicting the production and incorporation of MMCoA into PDIM and SL-1. MMCoA can be synthesized from propionyl CoA or from succinyl CoA via the action of MutAB. (B) PDIM region of FT-ICR mass spectra of crude extracts from wild-type M. tuberculosis containing either the MutAB expression construct or an empty vector as a control. (C and D) Overexpression of MutAB leads to attenuated growth in a mouse model of infection. BALB/C mice were infected via the aerosol route with bacteria containing either an empty vector (circles) or the MutAB expression construct (inverted triangles), or fadD26− bacteria containing an empty vector (squares). The data shown here is from one representative experiment of two. (C) Growth in the lung was monitored by harvesting at the indicated timepoints and plating dilutions on solid media containing kanamycin (open symbols) or without antibiotic (filled symbols). Growth on media without kanamycin revealed the total number of bacteria, whereas growth on media containing kanamycin revealed the number of bacteria that retained the plasmid. Each data point represents the average colony-forming units (cfu) from four to five infected mice, and error bars indicate the standard deviation of the means. (D) Survival of mice (n = 10 per group). (E) PDIM is produced in higher mass forms in a mouse model of M. tuberculosis infection. BALB/C mice were infected with a high dose (≈1,400 cfu) of wild-type M. tuberculosis, and lungs were harvested 19 days after infection. Bacillary loads in the lung at this timepoint were 8 × 10⁸ colony-forming units (cfu). Lipids were extracted from lungs and analyzed by FT-ICR MS. The data shown here are from one representative experiment of two. FT-ICR mass spectra from wild-type M. tuberculosis cells grown in vitro, with or without propionate, as described in Fig. 3B are also shown here for comparison. Average mass of PDIM in vivo is 1,430 amu as compared with 1,403 amu for cells grown in vitro without propionate and 1,456 amu for cells grown in the presence of 1 mM propionate. (F) PDIM region of FT-ICR mass spectra of crude extracts from wild-type cells grown on 0.1% glucose, or 10 mM acetate, propionate, butyrate or valerate as a sole carbon cource. Three contaminating peaks of polyethylene glycol from residual Tween-80 in the sample are marked with an asterisk in the spectra for cells grown on glucose.

