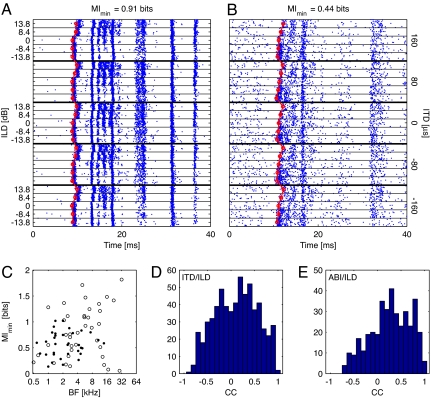
Fig. 1.
Examples of first-spike latency functions and information. (A and B) Spike rasters in response to the ITD/ILD stimulus set for two example neurons. Each box shows the first 40 ms of response to a particular stimulus, with multiple repetitions displaced vertically. (A) BF = 1.3 kHz; 109 repetitions. (B) BF = 4.1 kHz; 120 repetitions. (Left) Thin lines separate different ILDs. (Right) Thick lines separate different ITDs. The first-spike latencies are shown in red. First-spike latency information assuming an independent onset reference at the minimum latency of 5 ms (MImin) is given above each plot. (C) MImin is plotted as a function of BF for all neurons with >20 stimulus repetitions. Filled circles, ITD/ILD stimuli; open circles, ABI/ILD stimuli. (D and E) Histograms of all pairwise cross-correlations between first-spike latency functions for ITD/ILD stimuli (D) and ABI/ILD stimuli (E).

