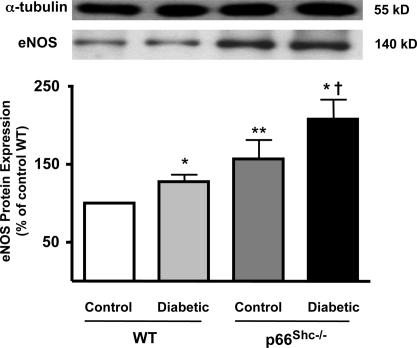
Fig. 7.
eNOS protein expression from aortas of control and diabetic WT and p66Shc−/− mice. Bar graphs show densitometric analysis of Western blots of eNOS protein in control and diabetic WT and p66Shc−/− mice. Results are presented as mean ± SEM; n = 6–9 in each group. ∗, P < 0.05 vs. respective control; ∗∗, P < 0.05 vs. control WT mice; †, P < 0.05 vs. diabetic WT mice.

