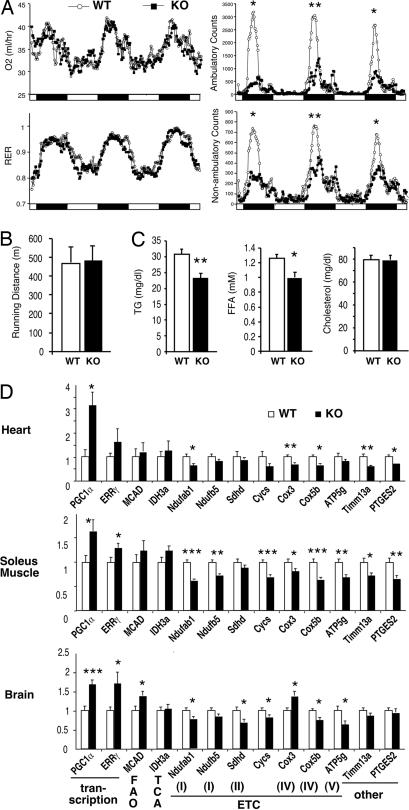
Fig. 2.
Basal metabolic analysis of PGC-1β KO mice. (A) O2 consumption, respiratory exchange ratio (RER), and activity of 7- to 9-week-old weight-matched WT (○) and KO (■) mice as measured by metabolic chambers. Light cycle (open bars) and dark cycle (filled bars) are indicated at the bottom. The data shown are the average of four mice for each genotype and represent results from multiple experiments using 12 mice for each group. *, P < 0.05; **, P < 0.005 at the peaks. (B) Running distance on an involuntary treadmill. (C) Serum lipid analysis of 8- to 9-week-old weight-matched mice. *, P < 0.01; **, P < 0.002. n = 12. (D) Q-PCR mRNA expression analysis in heart (ventricles; Top), skeletal muscle (soleus; Middle), and brain (cerebellum; Bottom). n = 6–8. *, P < 0.05; **, P < 0.01; ***, P < 0.0005. The gene functions are indicated at the bottom.

