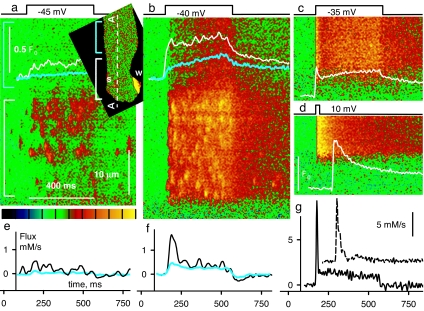
Fig. 5.
Response to voltage clamp of RyR3-transfected fibers. (a and b) F(x,t)/F0(x) in scans along line AA of fiber in Inset showing responses to Vm. In the segment marked by the white bracket the response consisted largely of sparks. In the rest of the image (cyan bracket in Inset and a) the response was eventless, like that of WT muscle (Fig. 3a1). White and cyan traces plot F/F0 averaged over x in the segments marked by color-matching brackets. (c and d) Responses to higher Vm in a second transfected cell. (e and f) Ca2+ release flux derived from the color-matched F/F0 traces in a and b. (g) Release flux derived from traces in c (solid) or d (dashed; note scale and horizontal shift for visibility in records at 10 mV). Unlike the WT (Fig. 3 b1 and c1), these responses show an early peak of fluorescence. Correspondingly, the peak in flux is more marked. Spatial scale is the same everywhere. Green in the color palette corresponds to F/F0 = 1, and yellow corresponds to 2.5 (a and b) or 3 (c and d).

