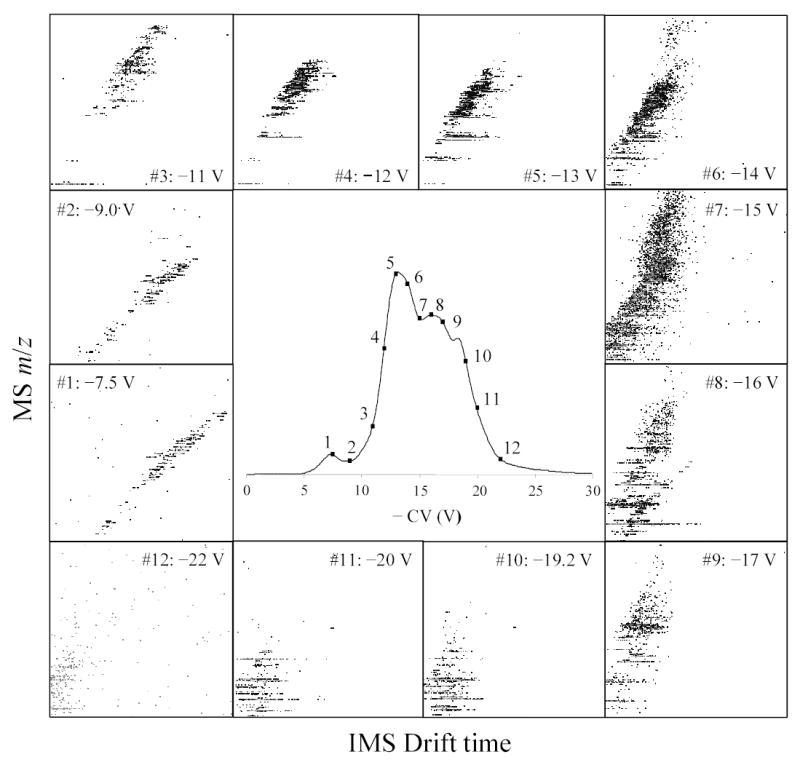
Fig. 3.

FAIMS CV spectrum for the test analyte mixture (central panel), and IMS/MS maps at 12 (out of 16 measured) CV values across the spectrum, as labeled (panels 1 – 12). All maps are for IMS drift times of 50 – 100 ms (horizontal axes) and m/z of 400 – 1200 (vertical axes). The four maps not shown were acquired at CV = 12.2, 12.5, 17.5 and 20.8 V.
