
FIGURE 3.
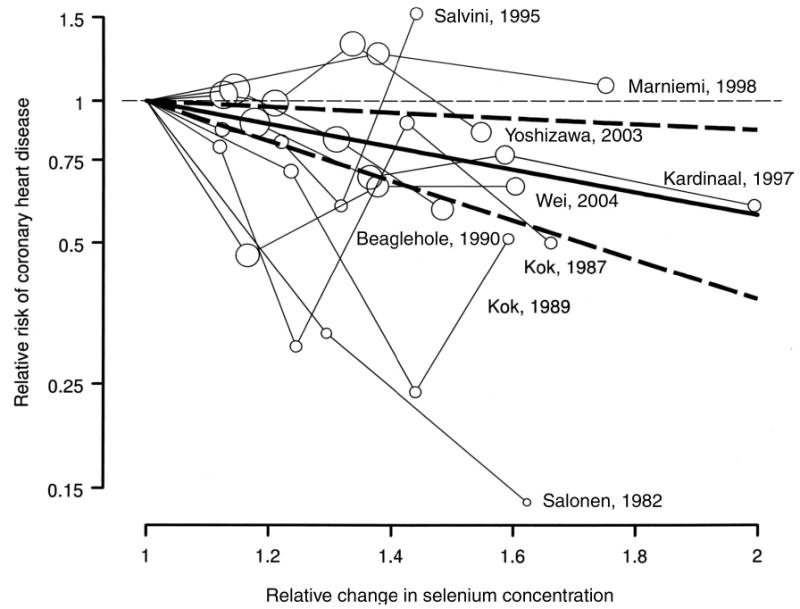
Dose-response meta-analysis of selenium and coronary heart disease in observational studies (shown by first author and year of publication). The pooled linear risk trend (thick solid line) and its 95% CI (dashed lines) were obtained by a random-effects dose-response meta-analysis. Circles are inversely proportional to the variance of log relative risks.