
FIGURE 1.
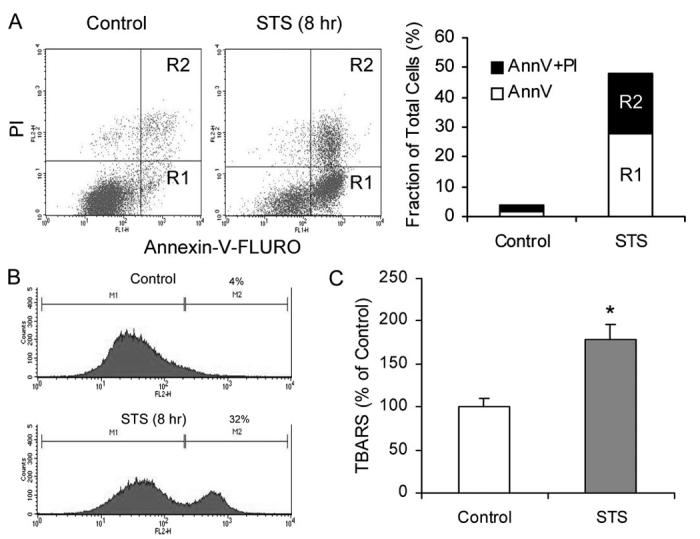
STS induces apoptosis, mitochondrial ROS generation, and membrane lipid peroxidation in INS-1 cells. A, FACS analysis of apoptosis as indicated by PS externalization. INS-1 cells were treated with or without 1 μM STS for 8 h. Cells were collected and stained with an annexin V (AnnV )-FLUOS labeling solution containing annexin V and PI, analyzed by FACS (left panel ), and results are summarized (right panel). R1 represents annexin V-positive and PI-negative cells, and R2 represents annexin V- and PI-positive cells. B, mitochondrial ROS production. Cells were collected and stained with 2 μM HE and analyzed on a BD Biosciences FACSCalibur. Representative histograms obtained are presented. The left histogram shows autofluorescence, and the right histogram shows cells containing converted HE. C, membrane lipid peroxidation. Cells were collected and treated with trichloroacetic acid/TBARS reagent. Each sample was incubated at 95 °C for 60 min. The supernatants were analyzed, and values are expressed as a percentage of control values. Data are the averages ± S.D. (n = 4). *, p < 0.05.