FIGURE 2.

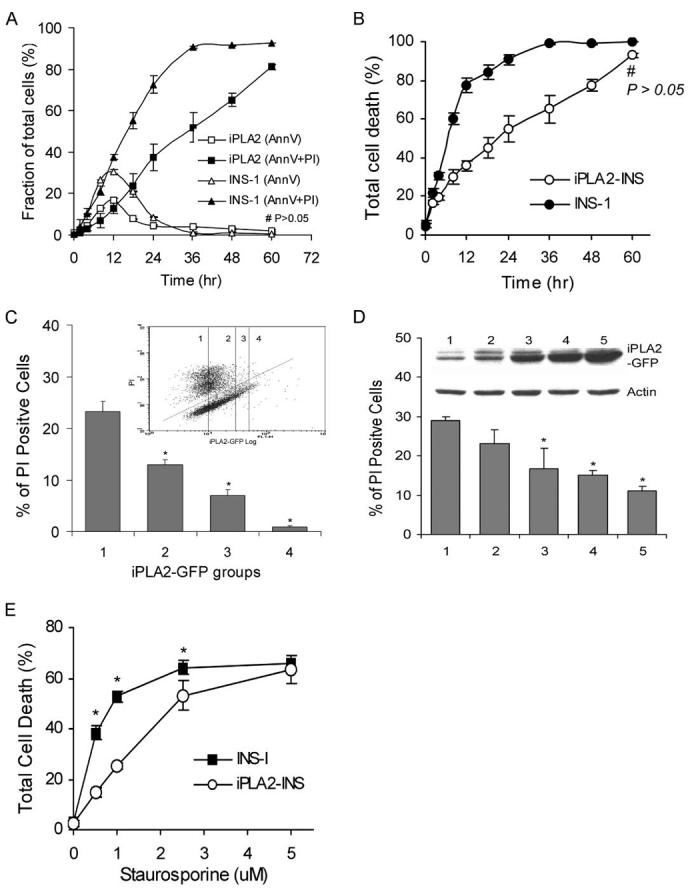
Comparison of STS-induced apoptosis in INS-1 and iPLA2-INS cells. A, time course of STS-induced early (annexin V-positive and PI-negative) and late (annexin V- and PI-positive) apoptosis in INS-1 (triangles) and iPLA2-INS cells (squares). B, total cell death (all annexin V-positive cells). INS-1 and iPLA2-INS cells were treated with 1 μM STS for increasing amounts of time. Cells were collected and stained with an annexin V-FLUOS labeling solution and analyzed by FACS. Data are the averages ± S.D. (n = 6). #, p > 0.05. All others were statistically significant. C, FACS analysis of cell death among cells with varying levels of iPLA2-GFP fusion protein. INS-1 cells were transiently transfected with iPLA2-GFP construct. After 48 h, the cells were treated with STS for 8 h, stained with PI alone, and subjected to FACS analysis (inset). Group 1 corresponds to non-transfected cells; group 2 are cells exhibiting a 1-2-fold increase in iPLA2-GFP; group 3 are cells exhibiting a 3-4-fold increase of iPLA2-GFP; group 4 are cells with a greater than 4-fold increase. Cells under the line are living, and those above are dead. The percentage of PI-positive cells in each group is displayed. Data are the averages ± S.D. (n = 4). *, compared with group 1, p < 0.05. D, STS-induced apoptosis in cell lines stably expressing iPLA2-GFP. INS-1 cells were transfected with iPLA2-GFP construct and selected with G418 after 48 h. Individual G418-resistant colonies were picked, and iPLA2-GFP expression was analyzed with anti-GFP antibodies (inner panel). Five cell lines with increasing levels of iPLA2-GFP expression were treated with STS for 8 h, stained with PI alone, and analyzed by FACS. Data are the averages ± S.D. (n = 3). *, compared with cell line 1, p < 0.05. E, Comparison of STS concentration-dependent apoptosis between INS-1 and iPLA2-INS cells. Data are the averages ± S.D. (n = 4). p < 0.05.
