
FIGURE 5.
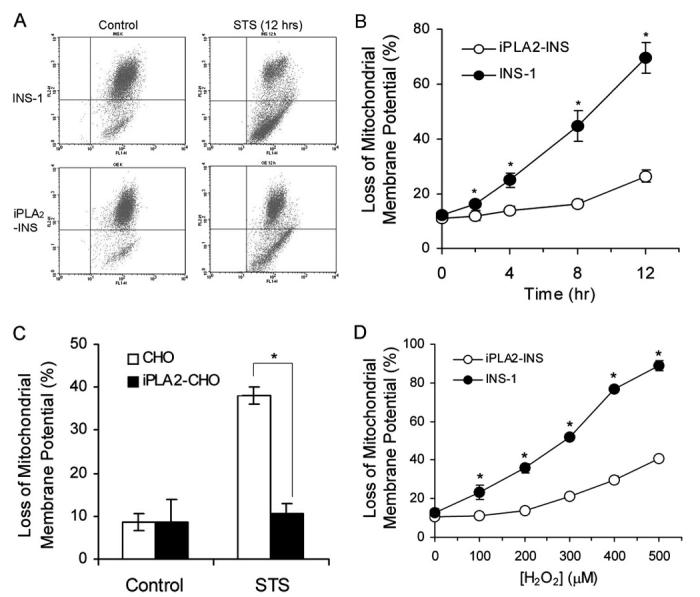
iPLA2 prevents the loss of mitochondrial membrane potential (ΔΨ). A, FACS analysis of the loss of mitochondrial membrane potential (ΔΨ). INS-1 and iPLA2-INS cells were treated with 1 μM STS for 12 h and labeled with JC-1 reagent for 15 min. After washing, JC-1-labeled cells were sorted by FACS. Cells under the horizontal line are the cells that lost the red color. B, time course of STS-induced the loss of mitochondrial membrane potential. INS-1 and iPLA2-INS cells were treated with 1 μM STS for increasing times and analyzed as in A. Values are expressed as a percentage of green versus total cells. Data are the averages ± S.D. (n = 6). *, p < 0.05. C, iPLA2 prevents the loss of mitochondrial membrane potential (ΔΨ) in CHO cells. CHO and iPLA2-CHO cells were treated with STS for 8 h. Data are the averages ± S.D. (n = 4). *, p < 0.05. D, iPLA2 prevents the loss of mitochondrial membrane potential (ΔΨ) after H2O2 treatment. INS-1 and iPLA2-INS cells were treated for 4 h with increasing concentrations of H2O2. Cells were then washed in PBS and labeled with JC-1. After washing, the cells were analyzed by flow cytometry. Data are the averages ± S.D. (n = 4). *, p < 0.05.