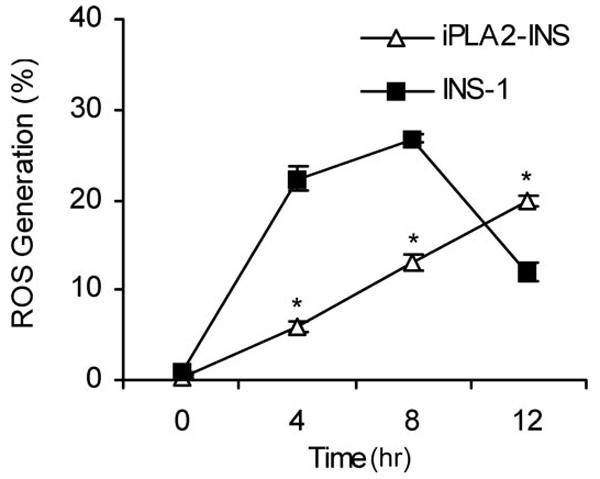
FIGURE 7.

iPLA2 reduces STS-induced ROS production. INS-1 and iPLA2-INS cells were treated with 1 μM STS, collected, stained with 2 μM HE, and analyzed by FACS. Values are expressed as a percentage of total cell counts. Data are the averages ± S.D. (n = 4). *, p < 0.05.
