
Figure 2.
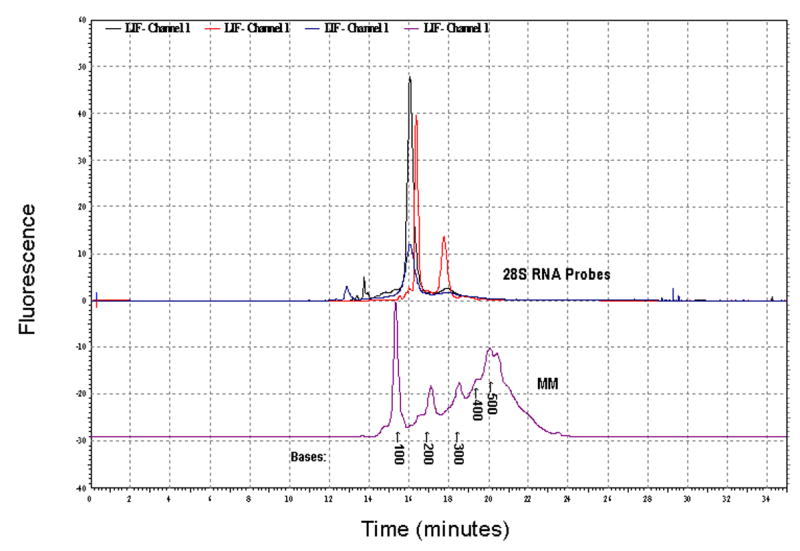
Characterization of Fluorescently labeled 28S rRNA Riboprobe. Multiple electropherograms representing independent probe synthesis reactions have been overlaid and are shown in the upper portion of this figure with a fluorescently labeled molecular weight marker (MM) shown in the lower portion. In each of the probe reactions, a major peak migrating between 15 and 17.5 minutes was observed. This migration time, when compared to the migration times for the molecular weight markers, would equate to a probe 155 bases in length.