
Figure 3.
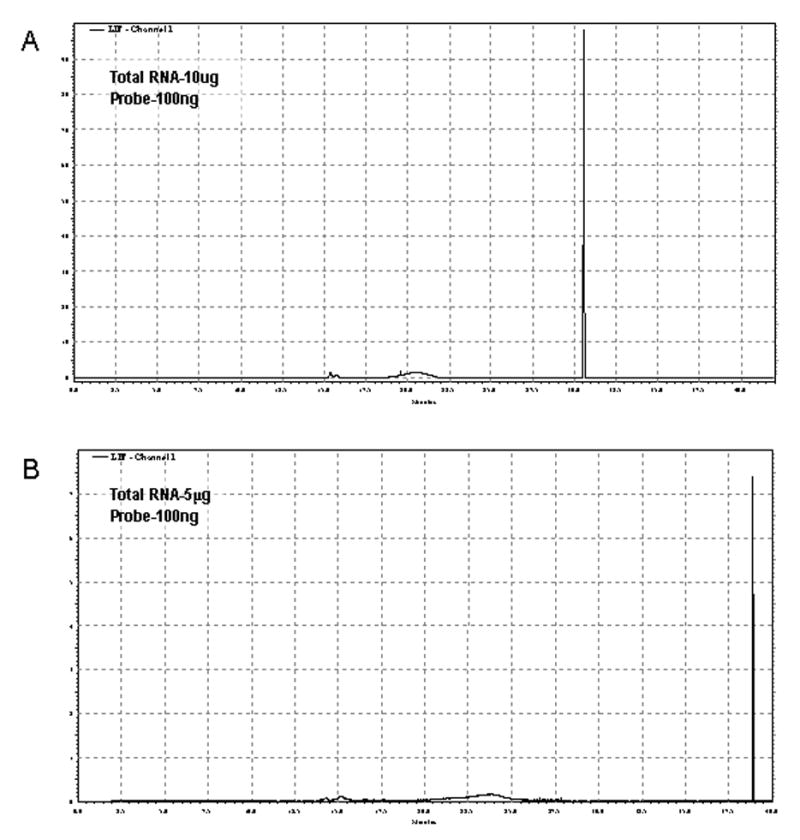
Post-hybridization Electropherogram. A representative electropherogram is shown for the hybridization of 5 μg of total RNA with the 488-28S probe. Note a small fluorescent peak corresponding to unhybridized, free probe migrating around 15 minutes and a second larger peak, representing the 28S RNA-488-28S probe hybrid was also detected.