
FIG. 4.
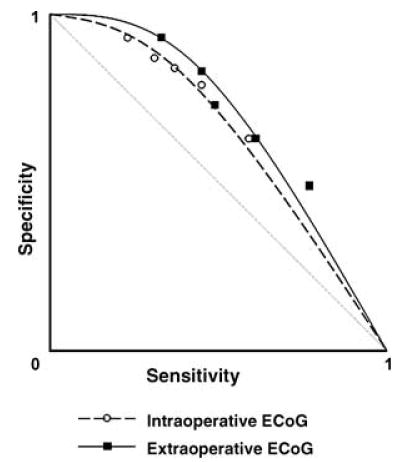
Receiver operating characteristics (ROC) curve. Cutoff thresholds of 40%, 20%, 15%, 10%, and 5% of the maximal spike frequency during intraoperative electrocorticography (ECoG) resulted in mean sensitivity of 0.22, 0.30, 0.35, 0.44, and 0.57, as well as mean specificity of 0.94, 0.87, 0.85, 0.79, and 0.63 for detection of “onset” electrodes, respectively. Similarly, cutoff thresholds of 40%, 20%, 15%, 10%, and 5% of the maximal spike frequency during extraoperative ECoG resulted in mean sensitivity of 0.32, 0.45, 0.47, 0.59, and 0.75, as well as mean specificity of 0.93, 0.84, 0.74, 0.64, and 0.50 for detection of “onset” electrodes. Sensitivity and specificity for each cutoff threshold are shown by white circles (for intraoperative ECoG) and black squares (for extraoperative ECoG).