
FIG. 4.
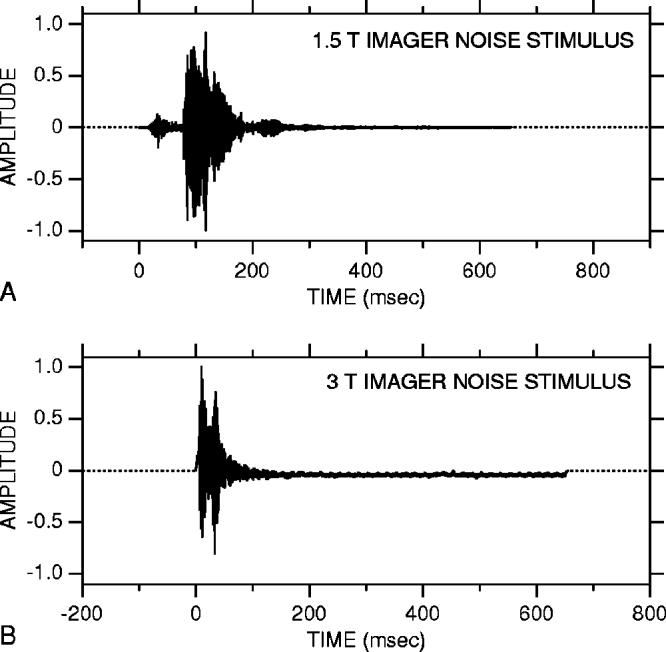
Imager noise stimuli. In each panel, the waveform from 0 to 650 ms is imager noise recorded in 1.5-T (A) and 3-T imagers (B); the remainder is zero padding (dotted line) for a 1-s presentation period. The high-intensity portions of the noise waveforms [e.g., 80–150 ms in (A), 5–40 ms in (B)] are due to gradient coil activity. The waveforms have been normalized to their respective peaks.