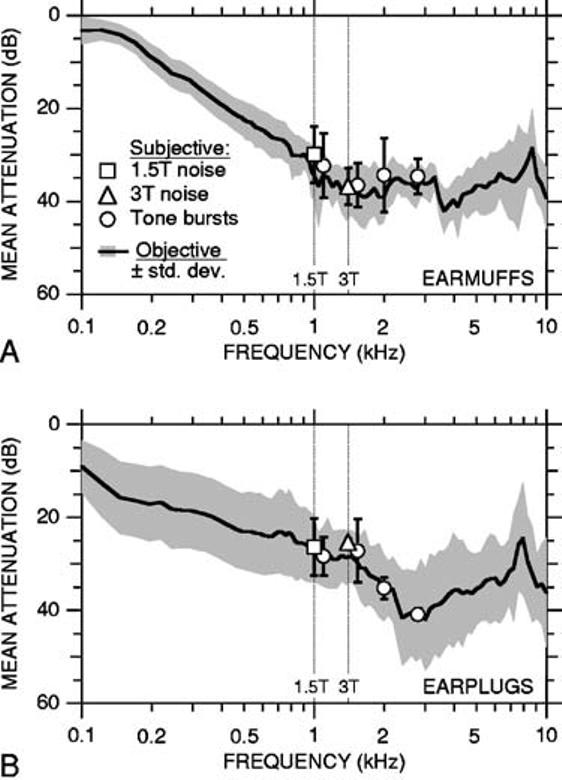
FIG. 5.

Attenuation of earmuffs (A) and earplugs (B). In both panels, the solid curve is the mean objective attenuation for nine ears (in seven subjects—earmuffs; six subjects—earplugs); shading indicates ±1 standard deviation (s.d.). Symbols indicate mean subjective attenuations in five subjects (earmuffs) or three subjects (earplugs); error bars indicate ±1 s.d. Subjective attenuations for tone bursts, 1.5-T imager noise, and 3-T imager noise are indicated by circles, squares, and triangles, respectively. For earplugs, ±1 s.d. was less than the dimensions of the symbols indicating the mean subjective attenuations for 3-T imager noise and 2.8-kHz tone bursts. Subjective attenuations for imager noise are plotted at the predominant gradient noise frequencies indicated by vertical dotted lines (1.5 T: 1 kHz; 3 T: 1.4 kHz). Subjective attenuations for tone bursts at 1 and 1.4 kHz have been offset horizontally to the right for clarity.
