
Figure 3.
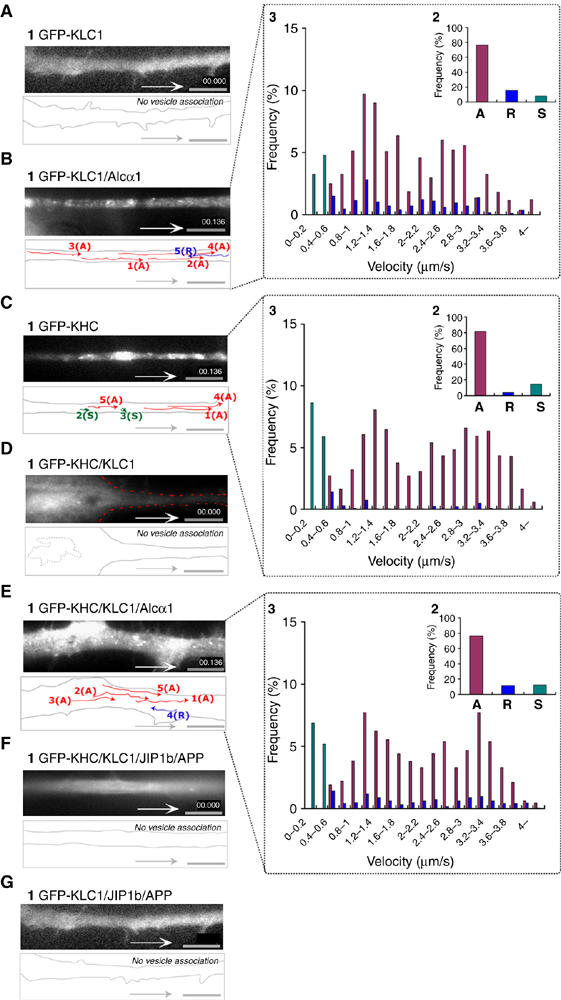
Vesicle association of kinesin-1 components mediated by Alcα1 cargo in axonal transport. (A, B) Vesicule association of KLC1 induced by Alcα1. Differentiating CAD cells expressing GFP-KLC1 with (B) or without (A) Alcα1 were observed with TIRF microscopy. (C, D) Inhibition of vesicular association of KHC by KLC. Differentiating CAD cells expressing GFP-KHC with (D) or without (C) KLC1 were observed with TIRF microscopy. (E, F) Vesicular association of KHC mediated by Alcα1 (E) but not by JIP1b and APP (F) in the presence of KLC1. (G) KLC is not vesicle associated in the presence of JIP1b and APP. (A–G) Vesicle movements were tracked with time-lapse imaging and are indicated with colored lines and numbers (panel 1; see Supplementary Movie 4, in Sup_5.mov). Red lines indicate tracks of anterograde vesicle transport, blue lines indicate tracks of retrograde vesicle transport, and green spots indicate stationary vesicles moving at less than 0.4 μm/s. Scale bar, 5 μm. Vesicles containing KLC or KHC transported anterogradely (‘A') and retrogradely (‘R'), and stationary vesicles (‘S') in 25 cells were counted with Metamorph software and the fraction of the total number of vesicles (%) is indicated (panel 2 of B, C, E). Distribution (%) of anterograde (red) and retrograde (blue) transport velocity of Alcα1 cargo, as well as stationary vesicles (green), is indicated (panel 3 of B, C, E).