
Figure 1.
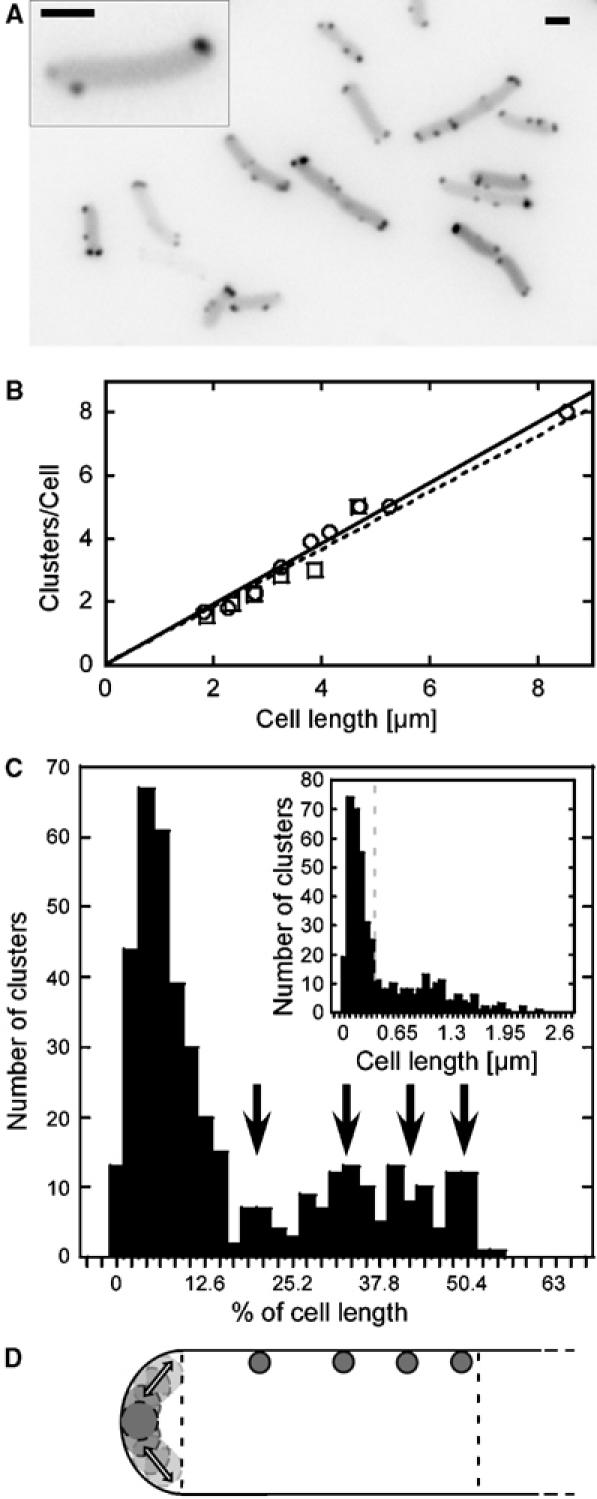
Intracellular distribution of chemoreceptor clusters. (A) Receptor clusters in exponentially growing wild-type RP437 cells were visualised by YFP-CheR expression from pVS102. The inset shows a close-up of a single cell. The lookup table (LUT) of the images was inverted to facilitate cluster recognition. Scale bars here and elsewhere are 1 μm. (B) Dependence of the number of clusters on cell length. Cluster were labelled in RP437 with YFP-CheR (open circles) or CheY-YFP (open squares) and counted in Z-stacks of images for 100 cells of each strain. Data were binned into 500 nm intervals of the cell length. (C) Distribution of a total of 429 cluster positions along the cell body in a population of 146 cells. Distance of a cluster from the adjacent pole was plotted as a fraction of individual cell length with a bin size of 2.1%, corresponding to an average of 0.065 μm or the size of 1 pixel. Peaks in the distribution are indicated by black arrows. Inset: same data set but plotted as absolute distance (μm) with a bin size of 0.065 μm. The grey dashed line indicates the polar zone, 0.26 μm. (D) Cartoon of cluster positioning in one half of an E. coli cell. Dashed lines indicate the polar zone and the mid cell. Preferred cluster positions are shown by the grey dots, corresponding to peaks in (C). Transparent circles and arrows at the pole indicate dynamic cluster positions within the polar zone.