
Figure 2.
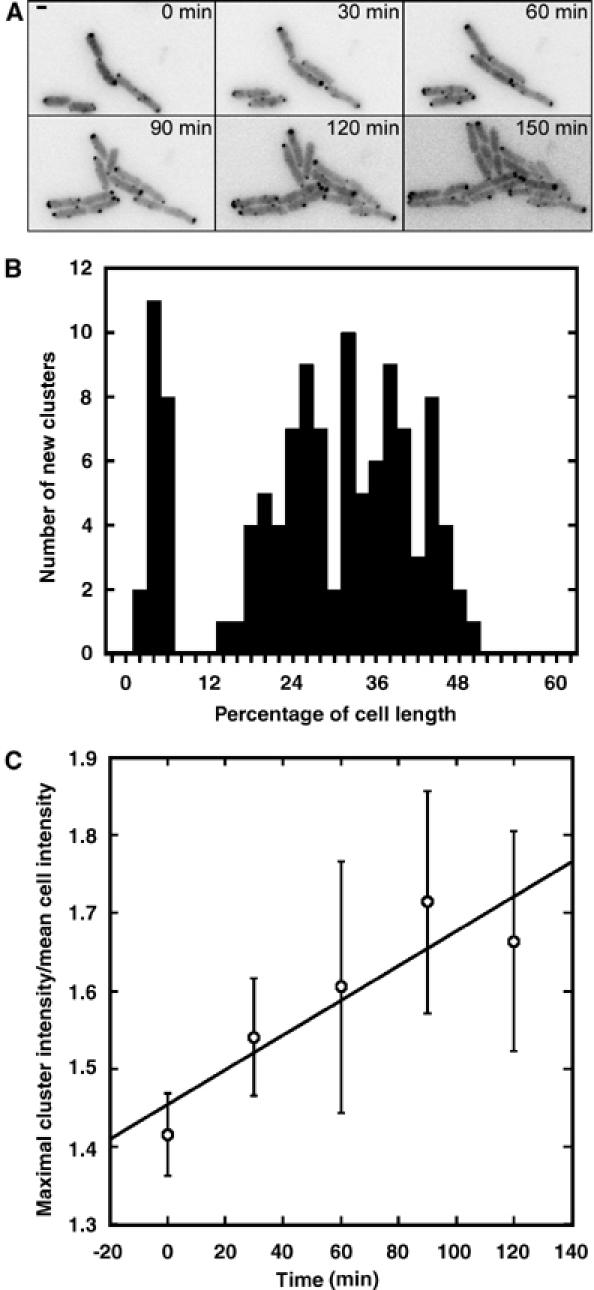
Appearance and growth of clusters. (A) Time-lapse images of growing VS162 cells, which express CheY-YFP from the native chromosomal location of cheY. (B) Positions of a total of 116 newly appeared clusters in a population of 68 cells, plotted as in Figure 1C. (C) Growth of newly appeared clusters, measured as an increase in the maximal cluster intensity; the values were normalised to the mean fluorescence intensity in a corresponding cell to correct for gradual bleaching during time-lapse experiments. Slope of the linear fit to the data is 0.002. Error bars indicate standard errors.