
Figure 3.
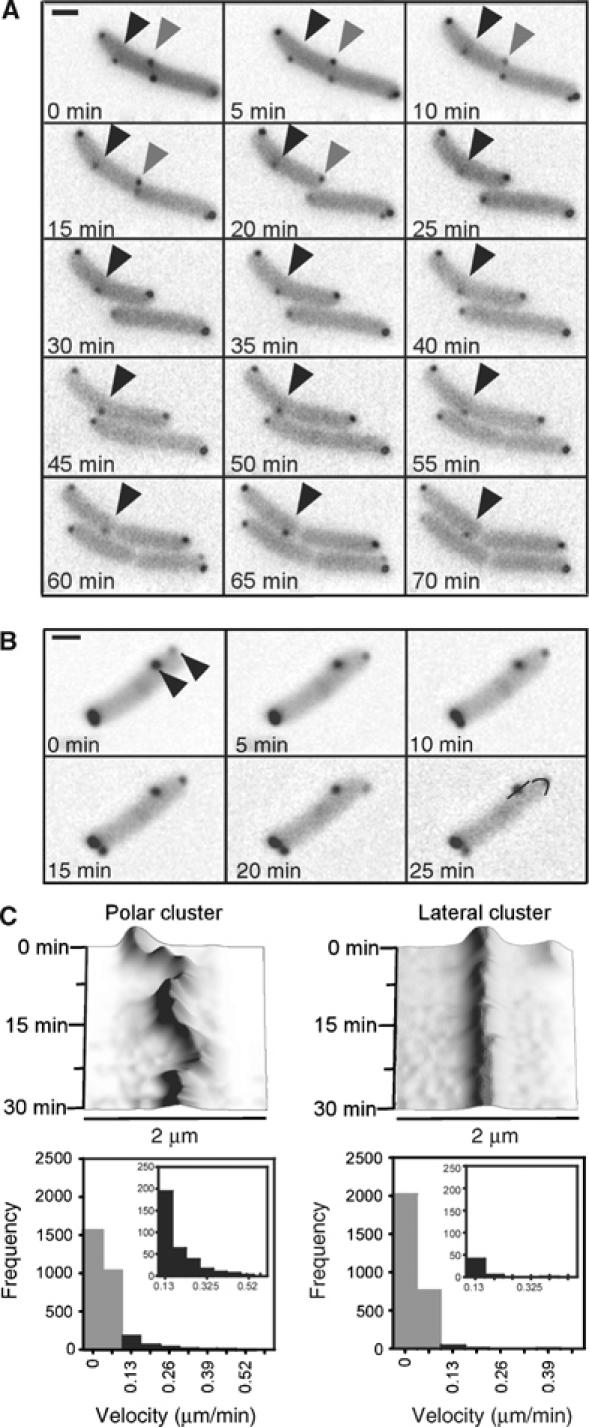
Cluster repositioning and mobility. (A) Time-lapse images of growing wild-type cells with receptor clusters being marked by YFP-CheR as in Figure 1. Grey arrow indicates a lateral cluster that was initially positioned at approximately 50% of the cell length and became polar after the next cell division (20 min). Black arrow denotes a cluster that was initially positioned at a quarter of the cell length and became polar two generations later (65 min). Corresponding movie is included as Supplementary Movie 1. (B) Time-lapse images used for cluster mobility analysis. Different from (A), the cells were placed on the agarose pads without tryptone broth and were not growing in course of the experiment. The arrows indicate a polar and a lateral cluster, respectively. Black lines in the last frame denote the line-type regions of interests used for generation of time–space plots. Corresponding movie is included as Supplementary Movie 2. (C) Mobility of polar (left panels) and lateral (right panels) clusters. Top panels: examples of time–space plots of movements of the two clusters shown in (B), made as described in Materials and methods. Bottom panels: distributions of the frame-to-frame displacement for 100 polar and 100 lateral clusters in the sequences of time-lapse images that were taken every 60 s. Bin size is 0.065 μm/frame. Grey bars denote a part of the distribution, with the displacement of no more than 1 pixel/frame, which corresponds to the noise in image acquisition and processing displacement; displacement of the same magnitude was observed perpendicular to the cell membrane. Insets show enlargements of the part of the distribution with significant cluster movement.