
Figure 4.
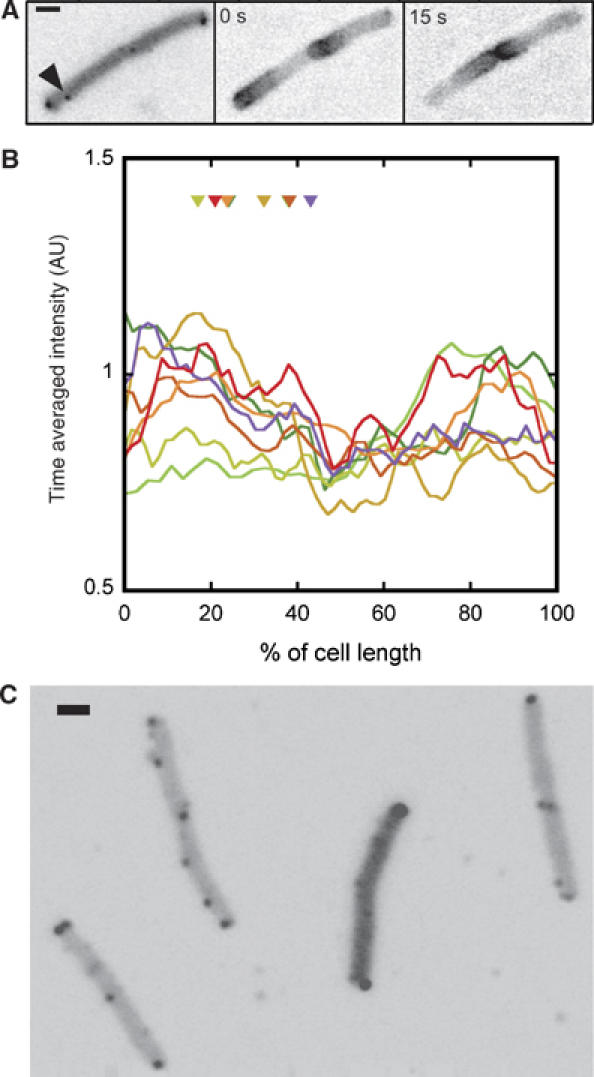
Independence of cluster positioning of the MinCDE system. (A) Receptor clusters, marked by CFP-CheR expression from pVS101 (left panel; the arrow indicates a lateral cluster), and oscillating YFP-MinD expressed from pSR4 (middle and right panels), visualised in the same cell. Expression of YFP-MinD was induced with 10 μM IPTG. (B) Time-averaged intensity profiles of the spatial YFP-MinD distribution and positions of lateral clusters (triangles) in eight individual cells, each marked by a different colour. (C) Clusters, marked by YFP-CheR as in Figure 1, in min (PB114) cells.