
Figure 1.
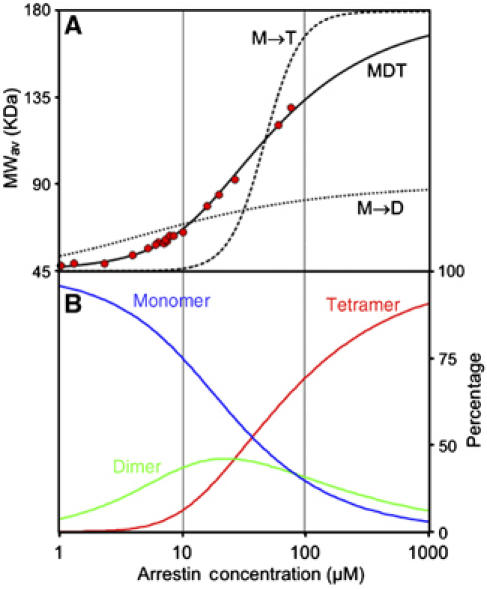
Arrestin cooperatively forms tetramers at physiological concentrations. (A) The average molecular weight of WT visual arrestin as a function of total arrestin concentration (red circles) was determined from the light scattering data as described in Materials and methods. The solid curve is a least-squares fit of the data to the MDT model with K1=2.7 × 10⁴ and K2=1.3 × 10⁵. For comparison, best-fit curves for dimer formation (M → D, K=1.3 × 10⁵, dotted black line) and direct formation of tetramers (M → T, K=2.5 × 10¹², dashed line) are shown. (B) The percentage of arrestin molecules in monomer (blue), dimer (green), and tetramer (red) as a function of total arrestin concentration computed for the MDT model, where K1=2.7 × 10⁴ and K2=1.3 × 10⁵.