
Figure 2.
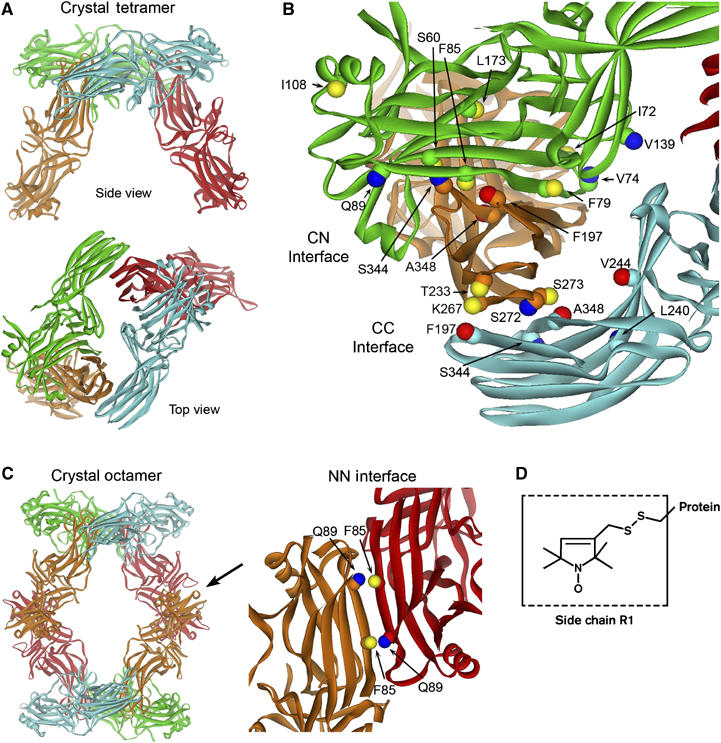
The interfaces of the arrestin crystal tetramer. (A) The 2.8 Å crystal structure of the visual arrestin tetramer (Hirsch et al, 1999), where monomers are colored differently for clarity. (B) The CN interface between the C domain of one monomer (orange) and the N domain of another (green) and the CC interface between two C domains (orange and cyan) are indicated. (C) The crystal octamer is shown highlighting the NN interface (arrow) between the N domain of one monomer (red) and the N domain of another (orange) in the adjacent tetramer. The sites examined in this study are labeled. Both the Cα and Cβ carbons are shown to indicate the direction in which the side chain projects. The Cβ atoms are color-coded based on the effect of R1 on oligomer formation: blue, no perturbation or small increases in Ko; yellow, moderate decreases in Ko; red, large decreases in Ko (see text). (D) The structure of the R1 spin label side chain.