
Figure 4.
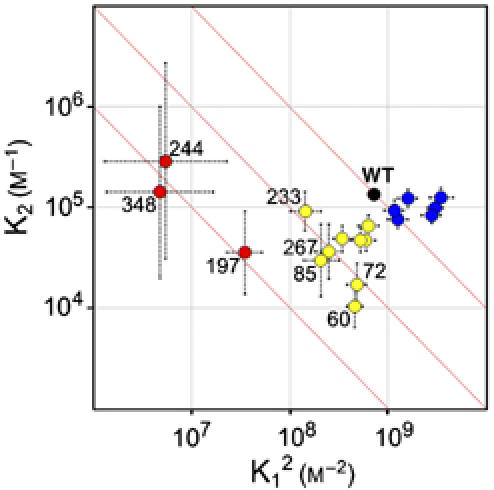
Comparison of the self-association constants of WT and spin-labeled arrestins. K12 versus K2 values for WT and spin-labeled arrestins are plotted on a logarithmic scale with estimated errors. The abscissa is plotted as K12 so that all mutants with the same Ko (K12K2; the overall tetramerization constant) lie on a line with slope of −1 and intercept of Ko. Three such lines (red) are shown for reference, one of which passes through the point for the WT protein (black dot). For convenience, the mutants are categorized into three groups, colored according to the effect on Ko; group 1 (red), large reduction in Ko; group 2 (yellow), moderate reduction in Ko; and group 3 (blue), no change or moderate increase in Ko. The large errors in K1 and K2 for group 1 are due to the limited concentration range explored and the large reduction in K1 produced by these mutants.