
Figure 5.
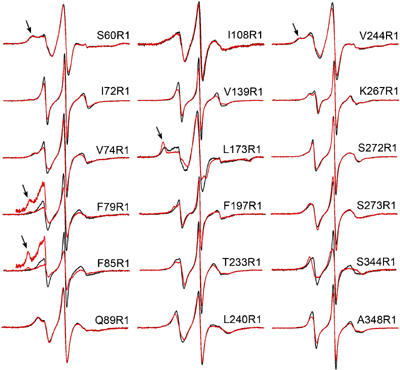
Concentration-dependent changes in the EPR spectra of R1-labeled arrestins. For each site, the spectrum was recorded for 10 μM spin-labeled arrestin (black trace) and in the presence of 180 μM WT arrestin (red trace). For 60, 79, 85, 173, and 244, arrows indicate components of the spectra corresponding to immobilized states of R1. The spectra are normalized to represent the same number of spins for each overlaid pair. The insets for F79R1 and F85R1 show a magnified view of the low-field region to more clearly reveal the immobilized components.