
Figure 6.
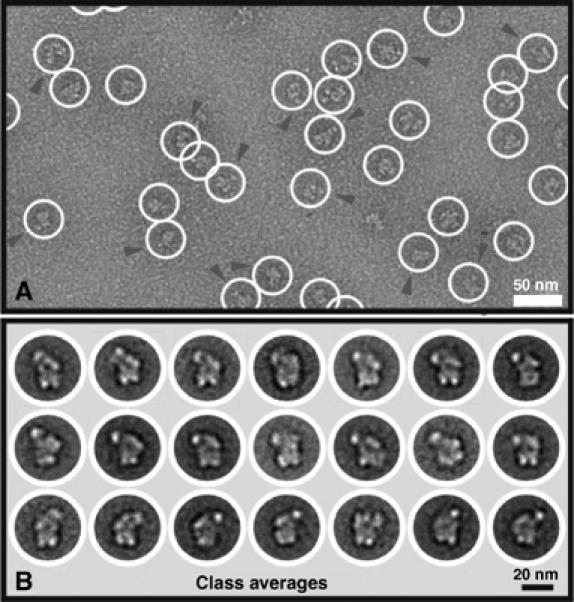
EM of the A complex and 2D analysis. (A) Typical EM image of the A complex taken with a 4k × 4k CCD camera in tile mode. The image reveals a homogenous population of globular particles (circled) with maximum dimensions of ∼260 Å (diagonal). In some views, the head-like domain has been marked by an arrowhead. (B) 2D analysis of the A complex. Multiple class averages are shown and reveal particles with a globular main body with two bottom protuberances and an upper side protuberance (pointing to the left in rows 1 and 2, and pointing to the right in row 3).