
Figure 3.
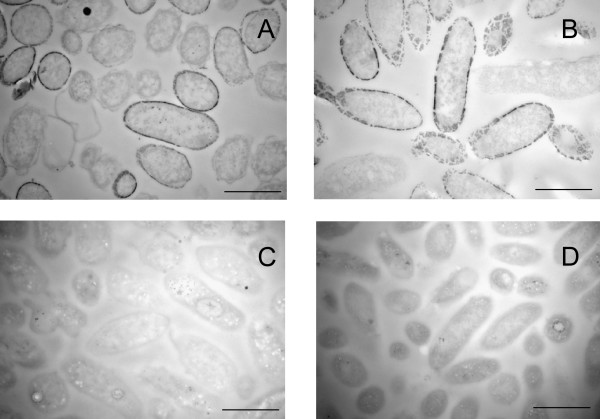
Transmission Electron Microscopy of thin sections of the U(VI) reducing strains DL1 (A and C) and MacA (B and D) before (A, B) and after (C, D) treatment with bicarbonate and air. Bar represents 1 μm
Official websites use .gov
A
.gov website belongs to an official
government organization in the United States.
Secure .gov websites use HTTPS
A lock (
) or https:// means you've safely
connected to the .gov website. Share sensitive
information only on official, secure websites.
Transmission Electron Microscopy of thin sections of the U(VI) reducing strains DL1 (A and C) and MacA (B and D) before (A, B) and after (C, D) treatment with bicarbonate and air. Bar represents 1 μm