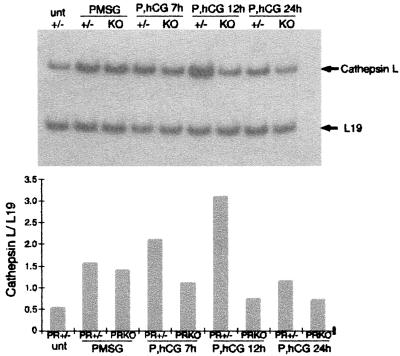
Figure 5.
Ovarian expression of cathepsin L. As determined by RT-PCR analysis of total RNA from whole ovaries of untreated (unt), PMSG-treated, and PMSG/hCG-treated (P, hCG) PR+/− (+/−) and PRKO (KO) mice, cathepsin L was induced by PMSG and to highest levels by hCG. The induction of cathepsin L in response to hCG did not occur in PRKO ovaries. Cathepsin L expression was normalized to expression of ribosomal protein L19.

