
Figure 1.
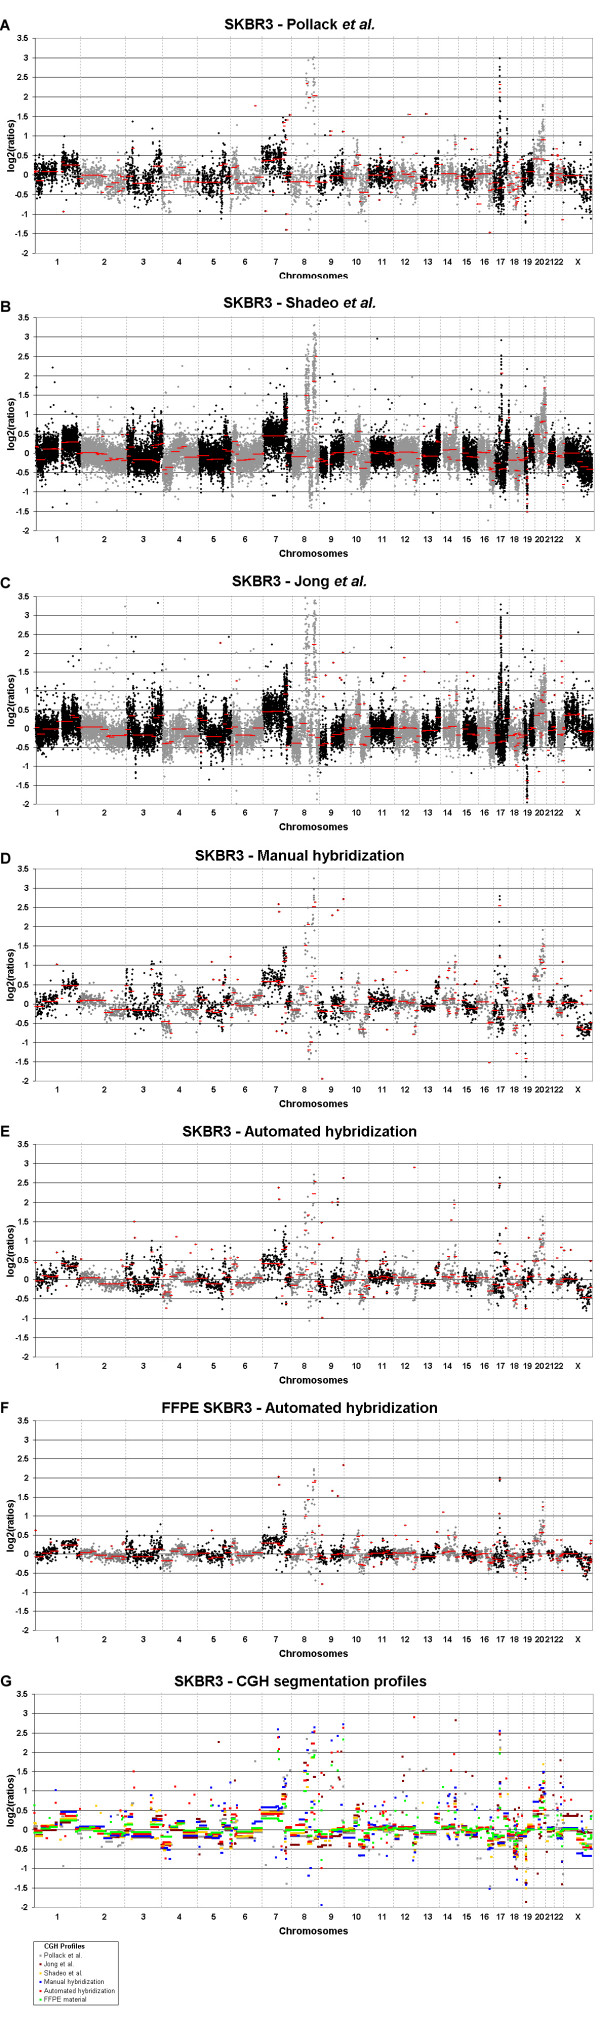
SKBR3 CGH profiles obtained by various methods. Chromosomes 1 to X (X-axis, alternate shading per chromosome) versus the log2 ratios (Y-axis) for the breast cancer cell-line SKBR3, hybridized by Pollack et al. (PNAS 1999) on a 6.7 k cDNA micro array, redrawn form values available on-line (A), hybridized by Shadeo and Lam (Breast Cancer Res 2006) on a whole-genome tiling path BAC array containing 32,433 overlapping BAC-derived DNA segments (B), hybridized by Jong et al. (Oncogene 2006) to a human oligonucleotide array containing 28,830 unique genes (C), manually hybridized to a 3.5 k BAC/PAC array (D), and hybridized using our optimal automated method (E). Formalin-fixed paraffin-embedded SKBR3 cell-line hybridized using our automated method (F). Red lines in panel A-F represent the breakpoint locations and copy number chances calculated by CGH-segmentation (BMC Bioinformatics 2005). Panel G contains all segmentation calls of the profiles depicted in panel A-F.