
Figure 2.
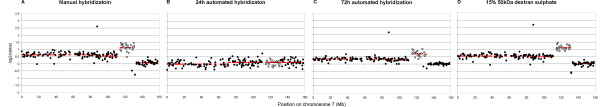
CGH profiles of manual and three automated methods. Chromosome 7 (X-axis), versus the log2 ratios (Y-axis) for the breast cancer cell-line SKBR3 (alternate shading for aberration legibility); manual hybridization (A, detail from figure 1D); 24 hours automated hybridization (B); 72 hours automated hybridization (C); 72 hours automated hybridization using 15% 50kDa Dextran Sulphate (D). With increasing hybridization duration from 24 to 72 hours, the CGH profile was more similar to the manual hybridization CGH profile. The aberration in panel C is detected in contrast to panel B (grey), even better with an increased concentration of dextran sulphate from 7 to 15% (panel D). Red lines in all panel represents the segmentation calls as calculated by CGH-segmentation.