
Fig. 1.
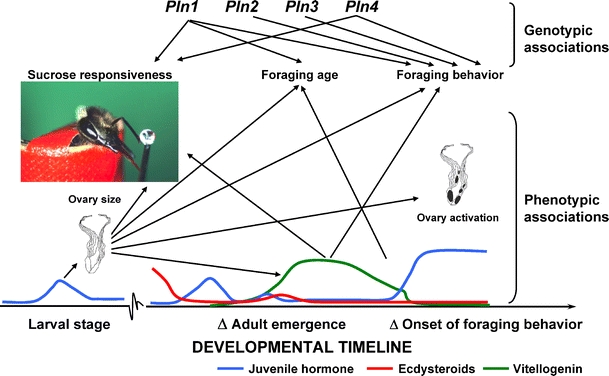
Genetic and phenotypic associations involved in foraging division of labor. Arrows indicate significant correlations between phenotypic traits at the levels of behavior, hormonal signaling, and development and associations between traits and genotypes at specific QTLs (pln 1–4). Colored lines indicate relative titers of specific hormones. The picture illustrates a method for determining the threshold concentration of sugar that a bee will respond to by extending its proboscis or tongue