Fig. 5.

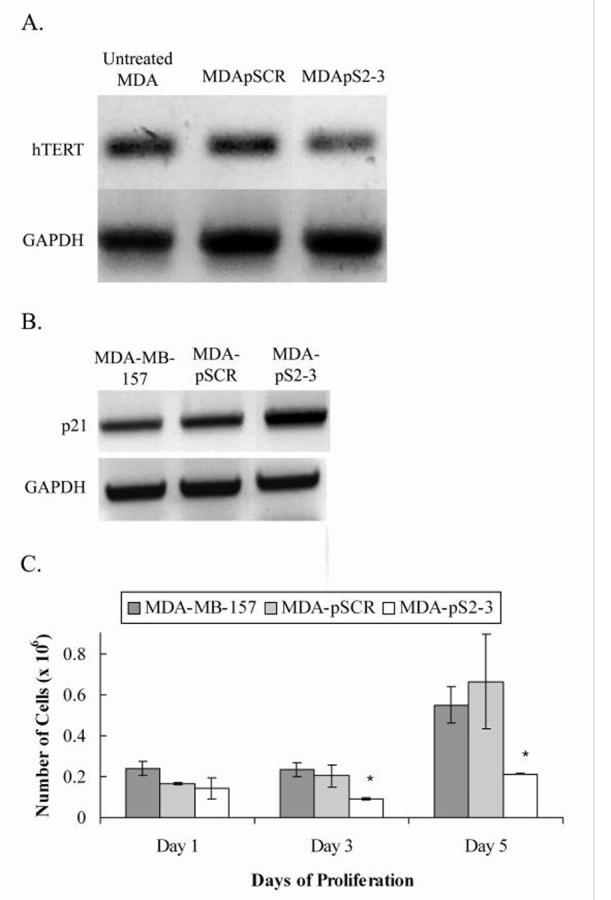
Gene expression and proliferation assays of MDA-MB-157 untreated control cells and cells transfected with plasmid constructs pSCR and pS2-3 (MDA-pSCR and MDA-pS2-3 respectively). A, Reverse transcriptase PCR of RNA extracts from treated MDA-MB-157 cells and untreated cells at 74 days after transfection. PCR was performed with primers specific to the gene of interest. hTERT mRNA levels showing hTERT knock down in MDA-pS2-3 as compared to the untransfected MDA-MB-157 and MDA-pSCR control cells. GAPDH was used as a loading control. B, Increased transcription of p21 was observed in pS2-3 as compared to the untransfected controls MDA-MB-157 and MDA-pSCR. GAPDH was used as a loading control. C, The graph shows parallel growth of controls MDA-MB-157 and MDA-pSCR, while MDA-pS2-3 shows growth inhibition. Y-axis error bars represent ± standard error of the mean (SEM). * denotes statistical significance (n = 3, p < 0.05).
