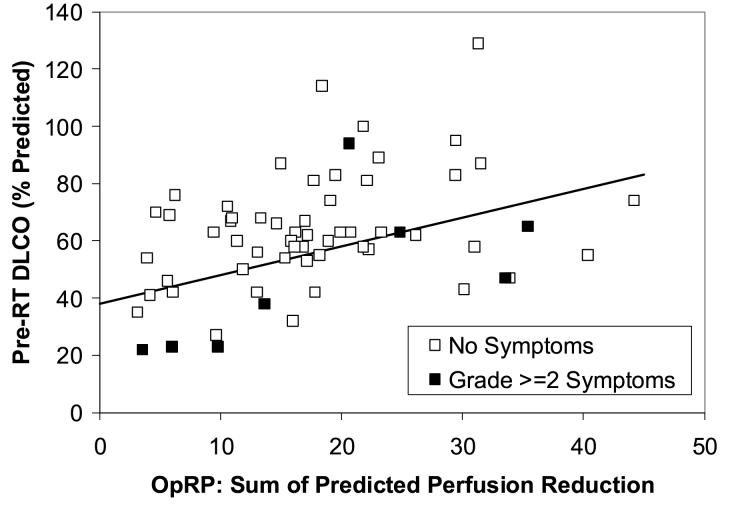
Figure 1.
The association between pre-RT PFTs (y axis) and the SPECT-based Overall Response Parameter (OpRP) (x axis) and the incidence of pneumonitis from the 62 evaluable patients with lung cancer and SPECT imaging in the 1999 analysis (8). The line represents the “optimal” segregation of the patients with and without pneumonitis and was derived retrospectively from the data.

