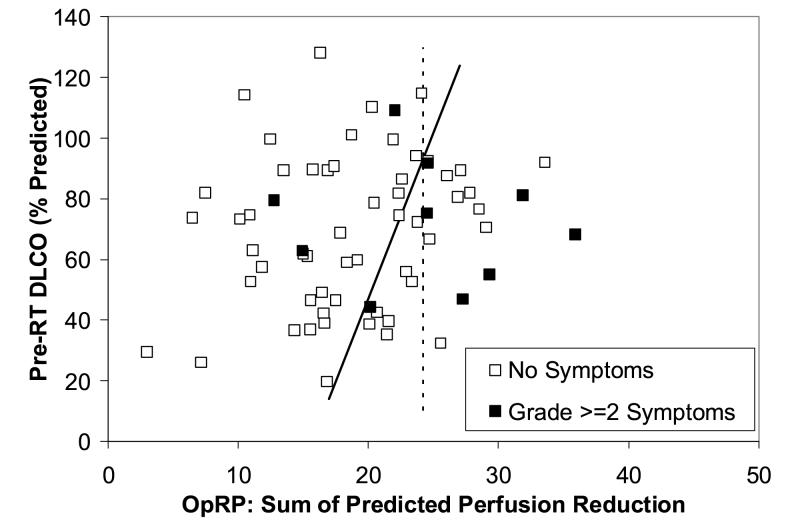
Figure 6.
The data shown in Fig. 4 is reproduced here, with retrospectively defined new segregations lines that are superior to the prospective line in Figure 4. The solid line (DLCO = 11 * OpRP - 173) considers both the OpRP and DLCO in segregating patients into high and low risk, the dashed line (OpRP = 24) uses only the OpRP.

