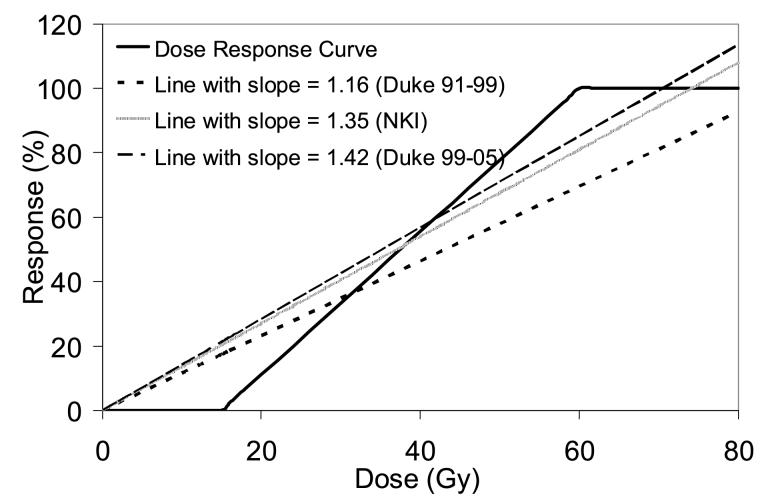
Figure 7.
The dose-response curve used in this study, compared against three linear approximations based on the three patient groups in this study (Duke 1991-1999, Duke 1999-2005, and NKI). The linear approximations are derived from the relationship between the OpRP and MpLD, shown in Figure 2. Line with smaller slope means more patients in that dataset were treated with higher doses, which flattens out the line since the DRC flattens out at >60 Gy.

