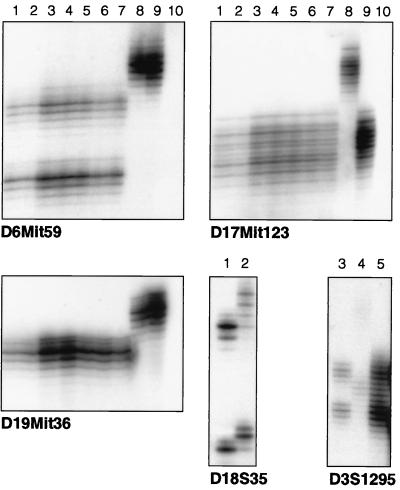
Figure 6.
Assessment of MSI in tumors. DNA templates from mouse and human tumors and controls were amplified by using primers flanking microsatellite alleles. Labeled amplified products were run on PAGE gels, dried, and exposed. The D6Mit59, D19Mit36, and D17Mit123 panels represent murine alleles amplified from Fhit +/− mouse 27 forestomach tumor (lane 1), Fhit +/+ mouse 25 forestomach tumor (lane 2), Fhit +/+ mouse 25 tail (lane 3), Fhit +/− mouse 21 sebaceous tumor (lane 4), Fhit +/− mouse 27 sebaceous tumor (lane 5), Fhit +/− mouse 27 second sebaceous tumor (lane 6), Fhit +/− mouse 31 sebaceous tumor (lane 7), K1735 mouse melanoma cell line (lane 8), NP3 mouse cell line (lane 9), negative control (no DNA) (lane 10). No MSI was observed in the mouse tumors for the three markers shown. The D18S35 and D3S1295 panels represent germline and tumor DNA from a human MTS case: DNA from peripheral blood lymphocytes (lane 1), DNA from sebaceous tumor 185 from the same individual (lane 2), lymphocyte DNA (lane 3), and DNA from sebaceous tumors 185 (lane 4) and 9029 (lane 5) from the same individual. These sebaceous tumors showed MSI at each allele successfully amplified.

