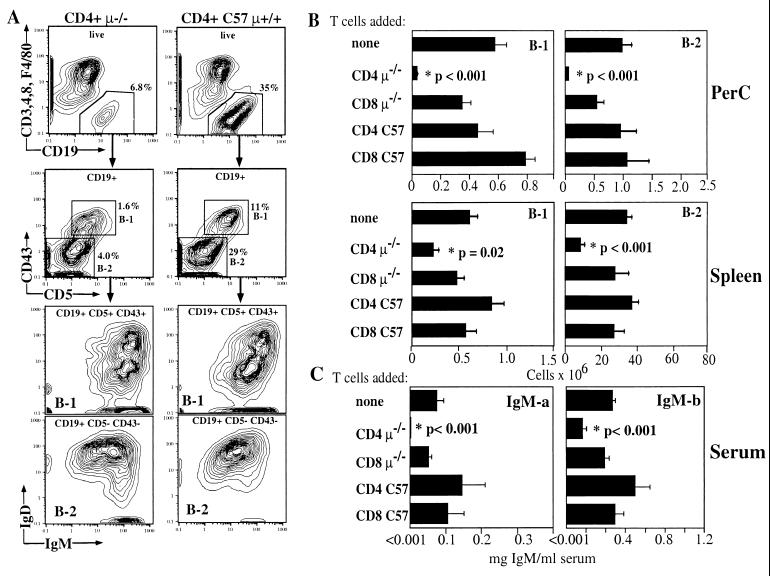
Figure 3.
(A) FACS analysis of PerC isolated from irradiated μ−/− recipients 2 months after cotransfer of 2 × 10⁶ FACS-purified CD4+ T cells from wild-type (CD4+ C57 μ+/+) or μ−/− mice (CD4+ μ−/−), 5 × 10⁶ PerC cells from C57/Igha and 3 × 10⁶ bone marrow cells from C57BL/6 (Ighb) mice. Contour plots (5%) are shown. The relative frequency of total live CD19+, CD3−, CD4−, CD8−, and F4/80− and IgDhi IgMlo follicular B-2 cells and IgDlo IgMhi CD5+ and CD43+ B-1 cells is indicated. (B) Summary of data from three independent transfer experiments with five groups (n = 6–10 per group) of recipient μ−/− mice that had received PerC (Igha) and bone marrow (Ighb) together with FACS-purified CD4+ or CD8+ T cells from either wild-type C57BL/6 or μ−/− mice, or no T cells. Total numbers (± SE) of the indicated B cell subpopulations in the peritoneal cavity and spleen are shown, calculated from the relative cell numbers obtained by FACS and total live cell counts obtained by counting acridine orange/ethidium bromide-stained cells. (C) Serum levels of PerC donor (B-1)-derived IgM-a and bone marrow-derived IgM-b (means ± SE) in the five groups of recipient mice determined by ELISA.

