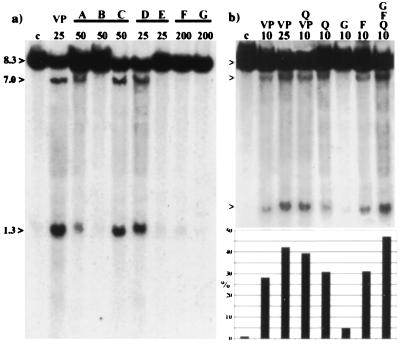
Figure 3.
(a) Southern blot of BV173 cells incubated with bioflavonoids with similar ring substitutions, but different ring saturation or geometry (also see Table 1). Above and from left to right: DMSO (C), VP16 (VP), lanes A, B, and C: 4′,5,7-trihydroxyflavonoids (A, apigenin; B, naringenin; C, genistein); D and E: 3,3′4′,5,7-pentahydroxyflavonoids (D, quercetin; E, taxifolin); F and G: 5,7-dihydroxy-4′-methoxyflavonoids (F, acacetin; G, biochaninA). Concentrations (μM) are indicated below. Germline (8.3 kb) and the cleavage fragments (7.0 kb and 1.3 kb) are indicated to the left. (b) Southern blot shows the accumulative activity of bioflavonoids. Above and from left to right: DMSO (C), VP16 (VP), VP16 and quercetin (Q, VP), quercetin (Q), genistein (G), fisetin (F), quercetin, fisetin, and genistein (Q,F,G). Concentrations (μM) are indicated below. Germline and the cleavage fragments are indicated to the left. Below the Southern blot is a densitometry graph, which represents the bioflavonoid cleavage activity in the MLL BCR. Each bar represents the percentage (%) of cleavage and corresponds to the lane above.

