
Figure 4.
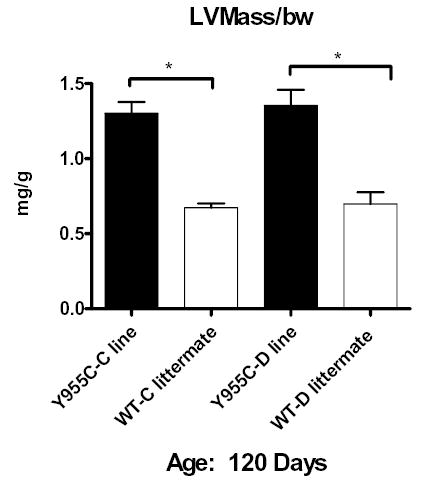
Quantitative analysis of ECHO images in Y955C Pol γ TG: LV mass was calculated in a blinded fashion, code was broken, and data tabulated from the Y955C Pol γ TG lines at 120 days. Data were normalized to body weight (mg/g) and plotted as mean ± SEM. At 120 days, line C and D had survivors. They exhibited cardiac mass that was >100% increased above that of WT (*p<0.01).