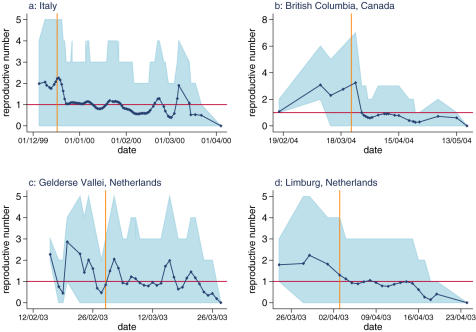
Figure 3. Estimates of the reproductive number over time for the four epidemics.
The estimates are obtained with the MLE for the generation time distribution parameters. The light blue area shows the 95% confidence intervals. The vertical orange line marks the date of reinforced controls. For British Columbia, this was the date the decision to cull the HRR region was taken, for the other datasets it is the date of detection of HPAI within the area.

