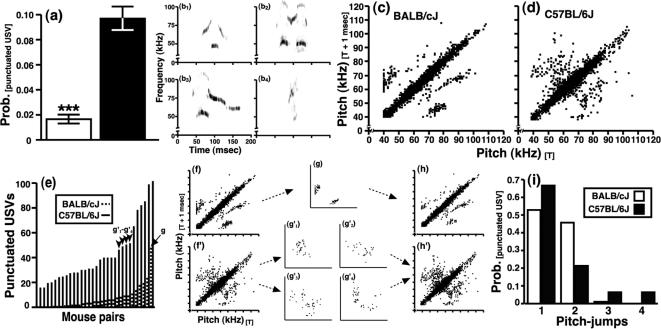
Figure 7.
Sonographic characteristics of punctuated ultrasonic vocalizations in relation to the genetic background of mice. (a) B6 mice emitted more punctuated USVs than BALB mice. Four sonographic traces illustrate the varied form of punctuated USVs emitted by early-adolescent mice: (b1) a BALB punctuated USV with 2 pitch-jumps, (b2) a B6 punctuated USV with 2 pitch-jumps and 2 harmonics corresponding to the 1st and 3rd elements of the vocalization, (b3) a B6 punctuated USV with 1 pitch-jump and 1 harmonic corresponding to the 1st element of the vocalization, and (b4) a B6 punctuated USV with 1 pitch-jump. (c) 141 BALB and (d) 140 B6 punctuated USVs were graphed as scatter-plots to illustrate the degree of internal frequency modulation present within individual ultrasonic syllables. Data points lying off the diagonal of each plot represent pitch-jumps. (e) Line graph depicting the number of punctuated USVs emitted during a 5-min interaction between mice that expressed the most punctuated USVs of each strain. The arrow and arrowheads denote pairs of mice that emitted a similar number of punctuated USVs. (f–f′) Data re-plotted from Figures 7c and 7d, respectively. (g) The pitch-jumps of punctuated USVs from one extreme BALB pair. (g1′–g4′) The pitch-jumps of four B6 pairs that produced punctuated USVs at a rate comparable to the BALB pair illustrated in Figure 7g. (h–h′) Data from Figures 7f and 7f′ with pitch-jumps from Figure 7g′ subtracted and the pitch-jumps from Figures 7g1′–g4′ added, respectively. (i) The total number of pitch-jumps within individual punctuated USVs for each strain graphed as a relative-density histogram.

