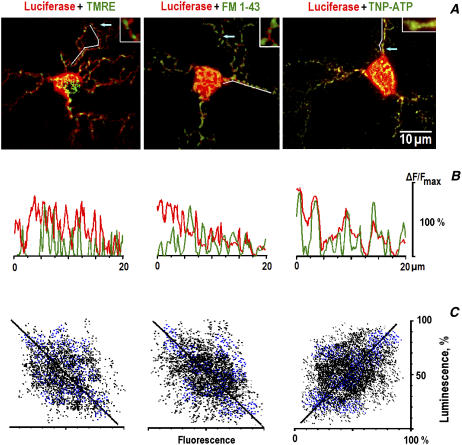
FIGURE 1.
Correlation among the positions of mitochondria, synaptic vesicles, and ATP. (A) Merged images of TMRE, FM 1-43, and TNP-ATP fluorescence (green) and the luminescence of luciferase (red). The arrows indicate the positions of enlarged (×8) areas shown in insets. (B) Curvilinear line scans of fluorescence (green) and luminescence (red) in dendrites are indicated by the white lines in A. The data were normalized to the maximal luminescence (fluorescence) in the respective frames. Note the negative (TMRE, FM 1-43) and the positive (TNP-ATP) correlations with the luminescence of luciferase in the corresponding line scans. (C) Spatial correlation between the luminescence and fluorescence signals. The black and blue dots indicate the amplitude of respective pixels in the soma and in dendrites. Linear regression gave the slopes of straight lines 1.05 (A), 0.97 (B), and 0.92 (C), respectively, and all correlation coefficients are >0.95. The differences between the overlap in the soma and those in dendrites were insignificant.

