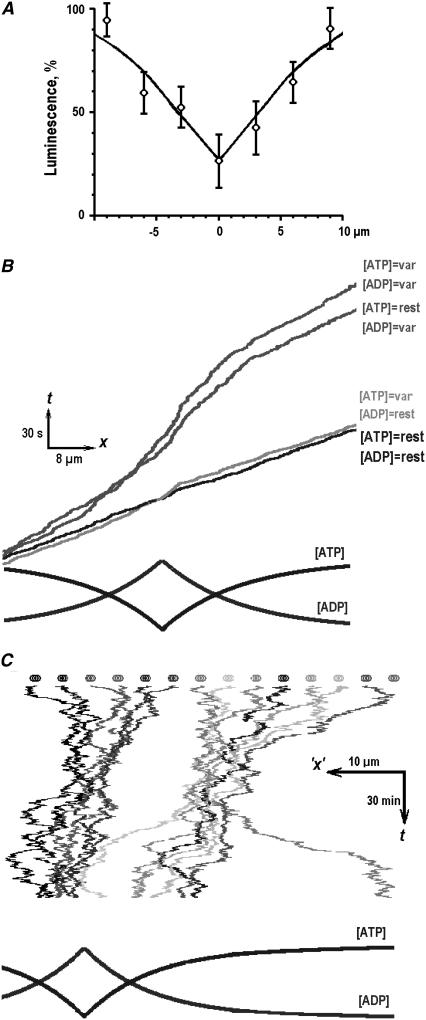
FIGURE 4.
Mitochondrial transport in nonuniform fields of [ATP]i and [ADP]i. (A) Mean [ATP] profile in dendrites. The data were obtained from the luminescence scans (21 in total), which were aligned according to the maxima of FM 1-43 fluorescence in dendrites identified as synaptic locations (see Methods). The experimental data points were approximated by Eq. 2 with the parameters C0 = 1 mM (the resting [ATP]i), C1 = 0.2 mM ([ATP]i at synapse), and the space constant 1/λ = 6 μm. (B) Monte Carlo simulations of the directed transport of mitochondria. The four kymographs show the results of simulations at resting [ATP]i = 1 mM and [ADP]i = 0.1 mM (denoted as “rest”), in varying profiles of [ATP]i and [ADP]i (denoted as “var”), and by using the profiles of either [ADP]i or [ATP]i with the concentration of another nucleotide fixed (the conditions of simulations are indicated near each curve). (C) Monte Carlo simulations of 16 mitochondria. The kymograph shows a 2-h-long simulation run performed using prescriptions described in Methods. Mitochondria were assumed to move bidirectionally in nonuniform profiles of [ATP]i and [ADP]i (shown in the lowermost panel), which models the concentration gradients in the vicinity of persistently active synapses.

