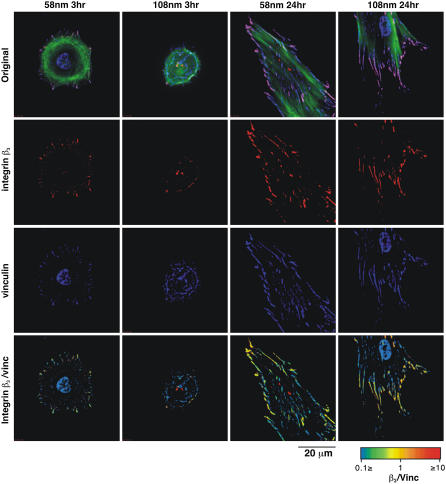
FIGURE 4.
Immunostaining and fluorescence ratio images (FRI) of focal adhesion proteins. REF52 cells transfected with GFP-integrin β3 were fixed and immunostained with primary antibody against vinculin, followed by Cy5-conjugated secondary antibodies. Actin filaments were visualized with phalloidin-TRITC. Cells on 58-nm and 108-nm RGD-nanopatterns were observed at 3 h and 24 h after plating. The rows present the images with integrin β3 in red, vinculin in blue, and actin in green. The last row shows the ratio between integrin β3 and vinculin intensities. FRI are presented in a spectrum scale as indicated in the lookup table.

