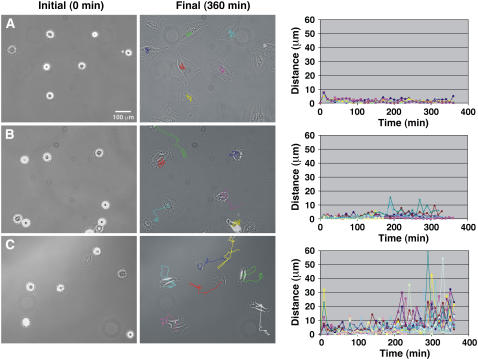
FIGURE 8.
Cell motility on surfaces presenting (A) homogeneous coating of RGD peptides, (B) 58-nm RGD-nanopattern, and (C) 108-nm RGD nanopattern. The center of mass of cells adhering to the surfaces has been measured; plots show the velocity of several cells by evaluating the change in position of the center of mass (indicated as distance in μm) as a function of time (min). The initial time of measurement is the beginning of cell spreading. In the final image after 360 min, cell trajectories are indicated by colored lines. Each line in the plot corresponds to measurements of a single cell. The whole movie can be found in the online Supplementary Material.

