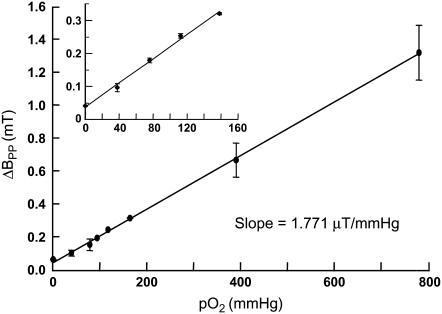
FIGURE 2.
Effect of pO2 on the linewidth of PTM-TE in HFB. The peak-to-peak linewidth of 1 mM PTM-TE in 50 μL of HFB was measured using an X-band EPR spectrometer under different oxygenation conditions as described in Materials and Methods. The linewidth data, expressed as mean ± SD from three independent measurements, showed a linear variation with pO2 (solid line, R2 = 0.98) with a sensitivity of 1.771 μT/mmHg in the 0–760 mmHg range. The inset shows the dependence of linewidth on oxygen concentration in the physiological range.

